History of Celbridge
The population of the town in the 19th and 20th centuries closely mirrored periods of activity and cyclical closures of the town’s woollen mills.
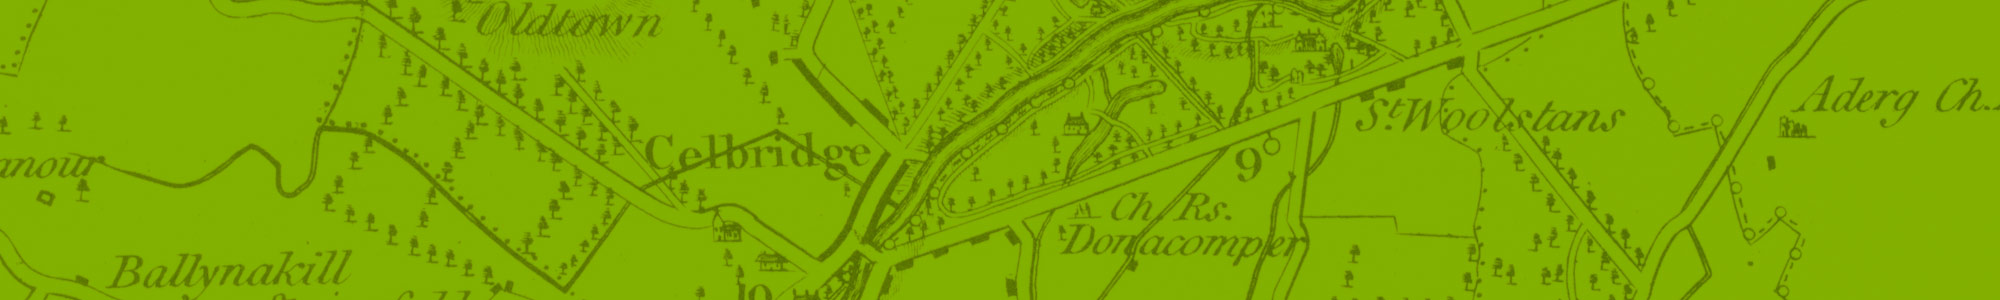
Recent research has linked Celbridge with the Slí Mór which crossed the Liffey at a ford located below the site of the mill directly east of the bridge rather than at Castletown House, as previously thought.
The left bank of the Liffey at Celbridge with both Saint Patrick (hill and church of uncertain antiquity in Ardrass) 53°20′20″N 6°31′37″W and Saint Mochua (c570), who was associated with a church in Tea Lane 53°19′33″N 6°34′40″W and a well on the site of the current mill where pagan converts were baptised.
The town of Kildrought or Kildroighid developed around the castle, monastery and mill of Kildrought which Thomas de Hereford, the Norman Lord of Kildrought erected early in the 13th century. A long street running between the de Hereford Castle and lands of Castletown, and the mill, had taken shape by 1314 when Henry le Waleys was charged at a Naas court of “breaking the doors” of houses in the town of Kildrought and by night “taking geese, hens, beer and other victuals” against the will of the people of the town. By the time of the Down Survey (1654–56) the population was 102.
The old Irish name Cill Droichid (Kildrought), meaning the church of the bridge, was anglicised to Cellbridge after 1714. Swift in his letters to Vanessa always named the place “Kildrohod”, but she replied from “Celbridge”.
Celbridge’s 18th century bridge had to be rebuilt after it was destroyed in a flood in December 1802.
Main Street (1720–50) was followed by the construction of Tea Lane (1760), Maynooth Road (1790), English Row (1805–11), Ballyoulster (1948–51), and St Patrick’s Park (two phases 1954-57 and 1964–67).
The construction of Castletown Estate from 1975 started a rapid period of population growth.
Population of Celbridge
1821 1,260 —
1831 1,647 +30.7%
1841 1,206 −26.8%
1851 1,674 +38.8%
1861 1,592 −4.9%
1871 1,391 −12.6%
1881 988 −29.0%
1891 811 −17.9%
1901 885 +9.1%
1911 812 −8.2%
1926 643 −20.8%
1936 627 −2.5%
1946 539 −14.0%
1951 567 +5.2%
1956 1,228 +116.6%
1961 1,371 +11.6%
1966 1,514 +10.4%
1971 1,744 +15.2%
1979 3,230 +85.2%
1981 4,583 +41.9%
1986 7,135 +55.7%
1991 9,629 +35.0%
1996 12,289 +27.6%
2002 14,251 +16.0%
2006 17,262 +21.1%
2011 19,537 +13.2%